Gender of Poets Winning Haiku and Senryu Contests
Can women write good haiku? R. H. Blyth, a major haiku educator of the English-speaking world, thought not: ‘Haiku poetesses are only fifth class’. He clarified that he believed it ‘doubtful… whether women can write haiku’. Wikipedia seems almost as dubious, listing thirty-three ‘Notable English-language haiku poets’ but including only one woman (3% of the total) on its page for ‘Haiku in English’. Roberta Beary related her 2014 interactions with the Ito-En (North America) contest organizers to urge them to include work by a woman poet in their website samples. Additionally, Beary’s research (reported in Towpath) found that, ‘within the haiku hierarchy women are treated as second-class citizens at best’.
Such events led me to assess the overall situation concerning women’s success in contests. I collected data on eight English-language haiku and senryu contests held between 1976 and 2018 to analyze what percentage of all their contest winners were women. My contests were varied in that I included some overseen by national organizations (BHS and HSA), some by reputed journals (Presence and Modern Haiku), and some by societies especially active in my region (YTHS and HPNC). The selected contests were all ‘blind’ meaning that coordinators removed entrants’ identifying information from submissions before forwarding them to judges. As a result, there should be no overt gender bias in selection of the winning poems with regard to the poet’s gender (although not necessarily with regard to choice of topic).
My research lets me offer a sense of the ‘gender climate’ in haiku contests today. Women are successful in every contest I explore, but more so in contests favouring the natural world rather than in senryu contests that emphasise the world of human affairs. Women enter more often than they win, and they win more often than they judge.
Two main types of concern arise about the usefulness of my statistical analyses below. The first type relates to whether I trust the results. Are the samples too small? Is there too much variation? Have I made assumptions that further dilute confidence? The answers are both ‘yes’ (my statistical tests are robust) and ‘no’ (my sample of contests is not random but a convenience sample, albeit stratified; I have no data on entrants for three contests; the five contests that offered entrant numbers could provide them for only between one and four years).
The other type of concern is whether this kind of statistical analysis could be inappropriate or misused. Colin Blundell, President of the British Haiku Society, expressed the very valid concern that ‘Aesthetic judgement is a very contorted business, not really amenable to percentages & statistical analysis’ (personal communication, 16 February 2019). Let me reassure readers that this article assembles data but does not critique the aesthetic judgements of any contest or judge.
The data on my ‘sample’ of eight contests comprise 197 contest-years (i.e., instances of a contest held each year). Through statistical analyses I can not only determine information about my sample but can also make inferences about the greater ‘population’ of all English-language haiku contests.
For this analysis, I assign to the gender of each judge or contest winner one of two values: 1 for female and 0 for not female. I omit (for reasons in the endnote) anyone whose gender is not known. Here are the mean (arithmetic average) and confidence interval (in which the mean for the entire population of contests is 95% likely to lie) for each of three categories in the 197 contest-years:
For judges, the mean is 38% women, confidence interval 32% to 44%.
For first-place winners, the mean is 44% women, confidence interval 37% to 51%.
For top-three winners, the mean is 47% women, confidence interval 43% to 51%.
Not one of the percentages is zero. This demolishes Blyth’s claims. The facts show that women compete successfully in blind English-language haiku contests. They win almost half. The first-place and top-three winners show considerable overlap of their confidence intervals, as expected. Women are called upon to judge these contests but at a lower rate than they win, the confidence interval for the judges being entirely below 50% and having only slight overlap with that for the top-three winners.
Next I compare the top-three winners in haiku versus senryu contests for the 197 contest-years:
- For haiku contests, the mean is 50% women, confidence interval 45% to 55%.
- For senryu contests, the mean is 40% women, confidence interval 32% to 48%.
The haiku winners centre on 50% but the confidence interval for senryu winners is entirely below 50%. I calculate a binomial distribution probability of 0.008 (a highly significant value of less than one in a hundred) that the mean of the whole population of senryu contests reaches 50%.
I exclude from the analysis of binary data any explicit information on entrants, which I obtain as a percentage not a binary. However, I can explore the binary data of winners for the five contests that provided entrant information versus the three not supplying it. The data show little overlap and raise the unanswered question of why women are substantially more successful in contests that supply entrant data than those (which happen to be contests of national organizations) that do not:
- First-place winners of the five contests supplying entrants have a mean of 49% women (confidence interval 40% to 59%) while the three contests not supplying entrants have a mean of 39% (confidence interval 32% to 45%). The overlap is small.
- Top-three winners of the five contests supplying entrants have a mean of 52% women (confidence interval 47% to 58%) while for the three not supplying entrants the mean is 42% (confidence interval 36% to 47%). The overlap is very slight. (The narrower confidence intervals arise here because the sample size is almost three times that of the first-place sample size; all but the BHS contest routinely award second and third places besides first place.)
Now I move to grouping the data by organizations. I do so believing that the analysis of the total contest-years presumes a homogeneity that the data do not entirely have. Furthermore, grouping by organizations lets me introduce entrants’ numbers, not included earlier because of their non-binomial values.
I treat each of the contests (HPNC haiku, HSA senryu, etc) as its own group for which I calculate its own mean (arithmetic average). Then I calculate the mean of those means. For each contest’s existence until 2018, I find these percentages of women in four categories:
| Category | Mean | Range | Number of contests supplying data |
| Judges | 38.9% | 16% to 58% | Eight. |
| First place | 43.8% | 31% to 56% | Eight. |
| Top three places | 47.7% | 37% to 64% | Seven. Excludes one contest (BHS) that does not usually award second and third places. |
| Entrants | 56.0% | 51% to 64% | Five. Excludes three contests (BHS and two HSA contests) that do not provide data on entrants. |
These means are very similar to those obtained above. Each range is from the minimum to the maximum calculated for all contest groups. Naturally such a range is larger than its corresponding confidence interval for 197 contest-years. Again, it is clear that women are called upon to judge contests at a lower rate than they win. Furthermore, it now appears that women judge at only two-thirds of the rate that they enter.
The graph below shows data in the four categories of interest. The horizontal axis indicates the average percentage of women in each category. Its values are from the second column of the table above. The vertical axis displays the percentage for each contest in each category:
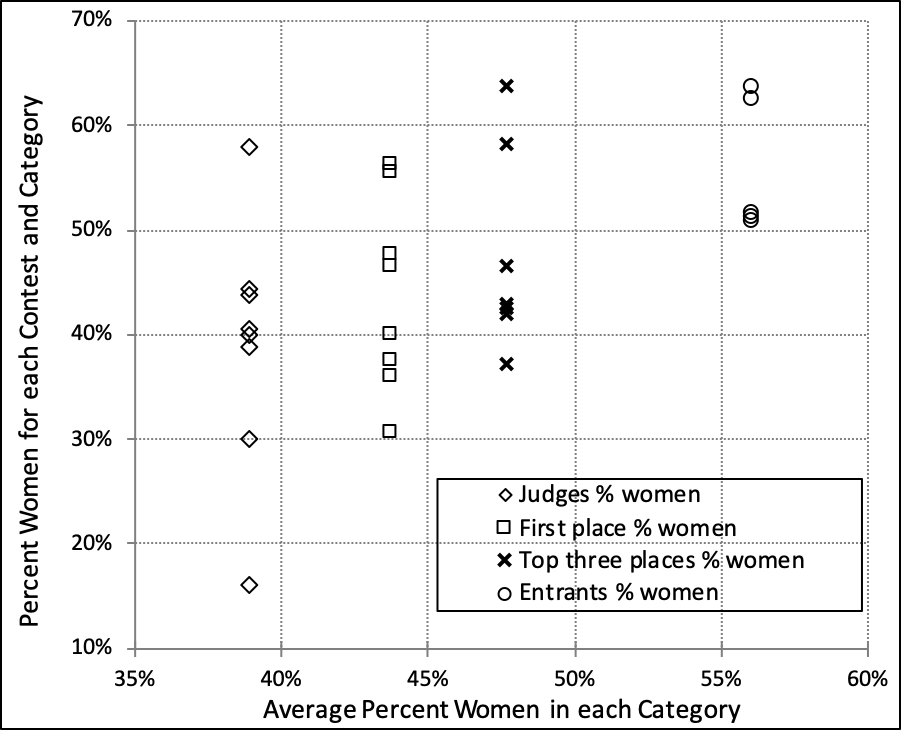
The column of eight diamond symbols on the left gives the percentage of each contest’s judges who are women. Its overall average is 38.9% (the horizontal axis). The individual values (the vertical axis) range from a low of 16% for BHS judges (25 years of data) to a high of 58% for HSA senryu judges (31 years). The right-most column shows a circle for each of the five contests where I have data on women entrants. Its overall average is 56%. The lowest value is 50.8% for the Modern Haiku/Spiess Competition (averaged over the last 3 of its 16 years) while the highest is 64% for the YTHS/Tokutomi contest (for the last 4 of its 36 years). The two central columns are for the first-place and the top-three contest winners.
The variation within each category is considerable, probably arising in part from different objectives among the contests. While some contests leave the submissions open-ended, two (the HSA and HPNC senryu contests) emphasise human affairs. The Modern Haiku contest asks entrants for haiku that illuminate a theme quoted from Robert Spiess. The YTHS contest requires a 5-7-5-syllable pattern and a single kigo (season phrase) from a brief list.
Variation is also due to the years each contest has existed. A single year’s data makes a large alteration to an average of the youthful Presence contest: in its first four years (2014-2017) 50% of the first-place winners are women, but for 2018 a man wins first place, making the five-year average (2014-2018) 40% women. Sensitivity even appears for the long-lived HSA haiku contest (43 years of data): women hold 47% of its first places but if a woman instead of a man won the 2018 first place, women would hold 49%.
Because of such sensitivity as well as the considerable overlap of percentages between categories, I am wary of using the apparent differences in the graph above to make claims about whether the differences for my eight contests hold over the entire population of all English-language haiku contests. To make credible assertions, I apply further statistical tools. I begin with the five contests for which I have information on the percentage of women entrants:
| Five contests with entrant data | Year started | Years documented | 1st place % women | Top 3 places % women | Entrants % women | Judges % women |
| 1. HPNC Haiku | 1996 | 21 (1 year for entrants) | 48% | 43% | 52% | 40% |
| 2. HPNC Senryu | 1996 | 20 (1 year for entrants) | 38% | 37% | 63% | 30% |
| 3. Modern Haiku/ Spiess | 2003 | 16 (3 years for entrants) | 56% | 58% | 51% | 44% |
| 4. Presence/Lucas | 2014 | 5 (3 years for entrants) | 40% | 47% | 51% | 40% |
| 5. YTHS/Tokutomi | 1978 | 36 (4 years for entrants) | 56% | 64% | 64% | 39% |
| Mean: 5 contests | 20 | 47.4% | 49.8% | 56.0% | 38.6% |
For these five contests, the percentage of women in the entrants tends to exceed the percentage in the winners. Moreover, the percentage of women in the winners tends to exceed the percentage in the judges. Beyond these bare facts, through statistics I can predict how likely it is that these inequalities apply to the entire population of all English-language haiku contests. I use the one-tailed t-test. It works with my small sample to determine whether categories in the underlying population of all contests average dissimilar or similar values. Conventionally, a probability of 0.05 or less indicates a low probability of similarity and a significant likelihood of difference. See the ‘Endnote on Data Collection and Statistics’ for more information.
Given the great difference between the percentages of women entrants and women judges, I first apply the t-test to these categories. I obtain a probability of 0.0009, which is highly significant statistically. It indicates that the underlying population of all English-language haiku contests has less than one chance in a thousand that the mean percentage of women among all entrants is not greater than the mean percentage among all judges: in other words, the percentage of entrants who are women is highly likely to exceed the percentage of judges.
The above table also shows a difference between the percentages of women taking the top three places and being judges. The t-test on those categories finds the probability is significantly low at 0.044 (less than one in twenty) that in the underlying population of all English-language haiku contests the mean percentage of women among winners of the top three places is not greater than the mean percentage among all judges. Therefore, the percentage of women in the top three places is significantly likely to exceed the percentage of judges. Similarly, the percentage of women winning first place is significantly likely to exceed the percentage of women judges: the probability is only 0.048 that this is not so.
Now I turn to three contests for which I could not obtain data on entrants. These contests, all run by national organizations, yield ninety-nine contest-years of data between them. The last two rows of the following table show the means (arithmetic averages) for these three contests and for all eight contests:
| Contests lacking entrant data | Year started | Years documented | 1st place % women | Top 3 places % women | Entrants % women | Judges % women |
| 6. HSA Haiku/ Henderson | 1976 | 43 | 47% | 43% | unknown | 44% |
| 7. HSA Senryu/ Brady | 1988 | 31 | 31% | 42% | unknown | 58% |
| 8. BHS Haiku | 1991 | 25 | 36% | not awarded | unknown | 16% |
| Mean: 3 contests | 33 | 37.7% | 42.3% | unknown | 39.4% | |
| Mean: 8 contests | 25 | 43.8% | 47.7% | 56.0% | 38.9% |
This sub-group is too small in itself and its data are too varied for these three contests alone to provide any additional insights with t-tests.
Next, I combine the data from all eight contests. A t-test reinforces the highly significant difference between entrants and judges, showing a probability of only 0.004 that they are not different. As found earlier, women average lower contest success in these three contests than in the five with entrant data. That causes the eight-contest average of winners to have lower percentages of women than the five-contest average. As a result the percentage of women among entrants is now significantly likely to exceed the percentage winning first place: the probability is 0.009 (less than one in a hundred) this is not so. The percentage of women among entrants has marginally significant likelihood that it exceeds the percentage of top-three winners: the probability is 0.052 this is not so. Interestingly, that same reduction in overall contest success causes the comparisons of judges with first and with top-three places to fall out of significance.
Lacking information on HSA and BHS entrants, I attempt a plausible approximation for their entrants: I suggest they could be similar to the percentages of women haiku poets in those societies’ anthologies. In the anthologies I have on-hand, I find 57% are women of the poets published for HSA and 49% for BHS. My approximation is not unreasonable because YTHS data show 64% women in their contest entrants, close to 67% woman as haiku authors in their anthologies. This approximation leads to quite similar probabilities to those for the eight contests. Of course, actual data from HSA and BHS would be more useful than my guesswork.
The low percentage of 16% women judges for BHS suggests that BHS data might be categorized as an outlier and omitted. That value is low because of special circumstances in which the contest began, when renowned haiku poet James Hackett initiated, master-minded, and paid for it. From 1991 to 2005 he single-handedly administered and judged the contest following an initial sifting by BHS (Colin Blundell, personal communication, March 2019). If I omit pre-2006 BHS data, the BHS judges rise to 31% women while the first-place winners fall from 36% to also become 31%. Omitting the BHS data on judges entirely, my t-tests find that the percentage of women among entrants is still significantly likely to exceed the percentage of judges; the probability is only 0.005 this is not so. I am dubious, however, of omitting the BHS judge data as a low outlier unless I would also omit the highest judge percentage of 58% women (HSA senryu contest), as it falls well above the confidence interval (32% to 44%) for judges.
Weighting the data according to the years of a contest causes only minor changes. This is confirmed by the similarities of the means obtained by the two different methods. Similarly I find little sensitivity to weighting contests for the number of entries (poems) they receive. Correlation of the gender of judges and winners appears insignificant.
One concern is the possible extent to which winners are altered in contests where few poets submit. Acorn editor Susan Antolin (personal communication, February 2019) comments that when ‘the number of entries is very low … just one or two very prolific and very skilled male poets sending entries … can skew the statistics quite a bit.’ Therefore I review the HPNC senryu contest’s recent twenty years. However I find no significant skewing of gender data. Three winners appear more than once, two being women and one a man: Carolyn Hall (first place twice), Claire D. Gallagher (first place twice though once as a co-winner), and John Stevenson (thrice). Here at least any ‘prolific poet’ effect has minimal influence on gender balance.
The results in this article are positive for women in that they win and place in the top three almost half the time. However I call for increased gender equity in contest judges so that as many women as men judge in the coming years. I do not deny the existence of individual situations of the kind that Beary reports, but my results show that women are quite successful in the world of haiku contests.
Separate research could explore whether men and women have different reasons for submitting, to see if this contributes to why a larger percentage of women poets tend to enter than to win or why a smaller percentage of women win senryu contests than haiku contests. Reasons for entering contests include pride of one’s work, ambition for glory or prizes, desire to support the organization or the coordinator, and the gambler’s excitement of possibly winning. Reasons I have heard for not entering include not having won in the past, having won too often (yes, this surprised me too), not writing in the style of a particular contest, the expense or bother of sending in an entry fee, and missing the deadline. Concurrently, it could be useful to gather data on whether some women and men feel they have submitted work within the scope of a contest but that was rejected because of a gender slant in their topic. Another exploration might be of the procedures by which judges are selected in different contests; perhaps an equal number of women are asked to judge but they decline more than men do.
I am willing to add other English-language haiku and senryu contests to this analysis, provided they are at least six years old and that the contest organizers share data on the percentage of women in recent entrants. If you can offer such data, please contact the author at ariadne@baymoon.com Having quantified the appearance of women overall in haiku and senryu contests, I am making similar analyses of journals and anthologies.
Acknowledgments
My first thanks go to Judy Kendall (Presence associate editor for book reviews and essays) for her invitation and encouragement to organize this material for Presence. I offer delighted appreciation to Susan Antolin (Acorneditor) for her interest, ideas, and discussions. While any and all errors and misinterpretations are my own, I am especially grateful to statistician Wilfrid S. Kendall from the University of Warwick for motivating me to add some of the analyses. My article benefits from the contest coordinators who gave me information on the gender counts of poets submitting to contests: Billie Wilson for Modern Haiku‘s Robert Spiess Memorial Haiku Awards Competition; Carolyne Rohrig for HPNC’s haiku contests and senryu contests; Gregory Longenecker and Mimi Ahern for the YTHS Kiyoshi and Kiyoko Tokutomi Haiku Award; and Ian Storr and Chris Boultwood for the Presence Martin Lucas Haiku Award. I relished attention, insights, and questions from Alison Woolpert, Charles Trumbull, Colin Blundell, David Grayson, Gregory Longenecker, Ian Storr, Patricia J. Machmiller, Patrick Gallagher, and Roberta Beary. Thank you to the many stalwart poets who have laboured with sensitivity as contest judges.
J. Zimmerman
Bibliography
Beary, Roberta. ‘Curbing Gender Bias in the Haiku Hierarchy’, Modern Haiku (2015, volume 46:2), pp.105-106.
Blyth, R. H. A History of Haiku Volume One (1963), p.34 and p.223.
Towpath, the Newsletter of the Haiku Poets of the Chesapeake Watershed (January 2015), p.1, summarizes Roberta Beary’s presentation of her unpublished paper, ‘The Mad Woman in the Attic: Curbing Gender Bias in the Haiku Hierarchy’ at a 2014 Haiku Society of America quarterly meeting.
Weaver, Kathleen F., et al. An Introduction to Statistical Analysis in Research (2017). ISBN: 978-1119299684
Wikipedia. https://en.wikipedia.org/wiki/Haiku_in_English (retrieved February 8th, 2019).
Endnote on Data Collection and Statistics
For this project I collected published results from journals and the Web for all the years I could find of the eight contests. I am grateful to Charles Trumbull for sending me BHS results for 1991-92 and 1996-2001 from his haiku database archive. I did not find contest results for 1993-95 for BHS, nor 1997-98 for the two HPNC contests, nor 2001 for the HPNC senryu contest. The YTHS contest was not held 1987-88 and 1990-92. Coordinators for five contests supplied me with the percent women among entrants for the 2018 contests and up to three previous years. To protect contest entrants’ information, I saw no list of the submitting poets or submitted poems. Coordinators sent me the totals of each gender and a total of their unknowns. We agreed that coordinators would omit from their gender counts any poet unknown to them whose gender was not clear from the name, having initials only or being an unfamiliar or a unisex name. Based on my own checks for a separate project on gender of poets published in journals and anthologies, when I find self-reported gender in biographical information on the Web, the average effect of the unknowns is not more than 1%. For my own counts, I was able to determine gender for the few initially unknown winners and judges. I assign to each judge or contest winner a gender value of 1 for female and 0 for not female. If judges or winners are paired, I assign the mean of individual gender values.
One of my statistical tools is the unpaired one-tailed t-test with unequal variance to compare various categories of data. For each comparison, I propose a ‘null hypothesis’ (in the jargon) whose likelihood I am to calculate. My first null hypothesis is the negative statement: ‘the underlying population of judges does not have a smaller percentage of women than the underlying population of entrants’. Its companion positive statement is the alternate hypothesis: ‘the underlying population of judges has a smaller percentage of women than the underlying population of entrants’. Because of the directionality of the hypothesis, I use a one-tailed (rather than two-tailed) t-test to calculate the probability of the null hypothesis. A probability of 0.05 or less indicates that the null hypothesis is significantly unlikely, and conversely that there is a significant likelihood of the alternate hypothesis. A probability of 0.01 or less shows high significance, while 0.10 or less means marginal significance. If you have questions about the test methods, please email ariadne@baymoon.com to contact the author.
— J. Zimmerman
Presence 64, July 2019
Available as a PDF